Pregunta a l'IA
Hola! Pregunta'm qualsevol cosa
TinkerPop

TinkerPop is an Apache project that provides the Gremlin Query Language, a beautiful piece of art. An easy way to have fun, while getting results from a graph. TinkerGraph and Gremlin Console are also part of TinkerPop.

Elephant provides a GraphML from all entities, generated with TinkerGraph. This documentation will help you get started with the Gremlin Console, and will provide some examples to use in your own data.

Gremlin queries
Gremlin can now be executed using the Gremlin Console and Groovy. The goal, though, is to have the Gremlin queries fully implemented into an Elephant project. As a result, the generation of new indicators may be the result of a Gremlin query.

Getting the entity.graphml file

Go to your User area, click on Reports, and select Entities GraphML. This will generate an email, with the entity.graphml file.

Security alert
This feature is only available to superusers.

Installing the Gremlin Console

Gremlin Console is an amazing tool that will allow you to explore your Elephant Entities like you never before thought possible.

The easiest way to install the console is using a Docker container. But you may find a more suitable way in their web page.

Running the console

Before running the console, you need to mount the folder where you will copy the GraphML file. In the example, the folder is located at /Public/tinker and we want it as /tinker inside the console.

docker run -it --rm -v ~/Public/tinker:/tinker tinkerpop/gremlin-console
This will create the standard welcome into your Gremlin console.
Nov 06, 2024 2:16:21 PM java.util.prefs.FileSystemPreferences$1 run
INFO: Created user preferences directory.

         \,,,/
         (o o)
-----oOOo-(3)-oOOo-----
plugin activated: tinkerpop.server
plugin activated: tinkerpop.utilities
plugin activated: tinkerpop.tinkergraph
gremlin>
Now, create the graph, the traversal and load the file, in the example entity.graphml.
gremlin> graph = TinkerGraph.open()
==>tinkergraph[vertices:0 edges:0]
gremlin> graph.io(graphml()).readGraph('/tinker/entity.graphml')
gremlin> g = traversal().withEmbedded(graph)
==>graphtraversalsource[tinkergraph[vertices:486 edges:850], standard]

Using a Groovy script

You can also save the commands in a .groovy file, and load it with the :load command.
entity.groovy file
graph = TinkerGraph.open()
graph.io(graphml()).readGraph('/tinker/entity.graphml')
g = traversal().withEmbedded(graph)
Loading the Groovy script
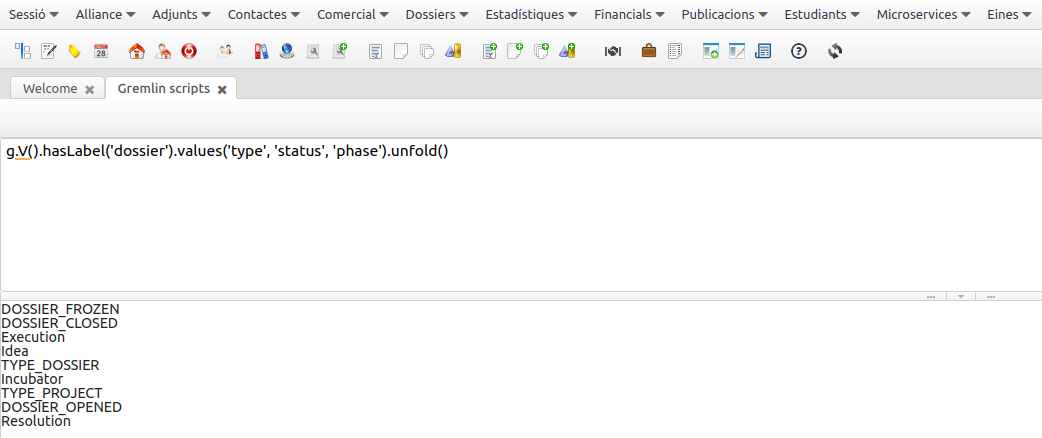
gremlin> :load /tinker/entity.groovy
Now you're ready to start running queries
Graph model

The Model

Along with the data graph, you can also download the model graph, which is reverse engineered from your actual data.


This is an example of model distribution.

The graph is independent of the graph model. Your data will be all included in the generated graph. The model is meant to be an extra help, to understand your data.

The Graph

These are Fruchterman Reingold layouts from the Elephant generated Graph. We used Gephi to visualize the graph, and we will be using Gremlin Console to query the graph.

Useful queries
Typified vs non-typified

Properties like phase or type are typified, accepting only certain values. Some of these queries will help you get the valid values from a specific property.

Non-typified properties, like name or title, are expected to be all different.

Possible values of contact's type

g.V().hasLabel('contact').values('type').dedup()

Possible values of dossier's phase

g.V().hasLabel('dossier').values('phase').dedup()
Contact queries

How many contacts per type?

g.V().hasLabel('contact')
     .groupCount().by('type')

How many workers per company?

g.V().hasLabel('contact').has('type', 'CONTACT_COMPANY')
     .project('Name', 'Workers').by('name').by(in('works').count())

How many workers per company, ordered from most to least?

g.V().hasLabel('contact').has('type', 'CONTACT_COMPANY')
     .project('Name', 'Workers').by('name').by(in('works').count())
     .dedup().fold().order(local).by(select('Workers'), desc)

How many students per learning center?

g.V().hasLabel('contact').has('type', 'CONTACT_LEARNINGCENTER')
     .project('Name', 'Students').by('name').by(in('studies').count())

How many docents per learning center?

g.V().hasLabel('contact').has('type', 'CONTACT_LEARNINGCENTER')
     .project('Name', 'Docents').by('name').by(in('teaches').count())

Contact's name and type

g.V().hasLabel('contact').valueMap().select('name', 'type')

Contacts' outgoing relations

g.V().hasLabel('contact').outE().inV().path().by('name').by(label)

How these two contacts are related, using business, dossiers and convocations?

g.V().hasLabel('contact').has('name','Contact 1')
     .repeat(both('participates','works','organizes','invites').simplePath())
       .until(and(
         hasLabel('contact').has('name','Contact 2'),
         loops().is(lte(10))
       ))
     .limit(20)
     .path().by('name')

Finding contact's matchings

g.V().hasLabel('contact').has('name','Contact name')
     .repeat(both('participates','works','organizes','invites','parent'))
       .until(and(hasLabel('contact').has('type','CONTACT_USER'),not(cyclicPath())))
     .limit(600)
     .path().by('name')

Sorted contact's matchings

g.V().hasLabel('contact').has('name','Contact name')
     .repeat(both('participates','works','organizes','invites','parent'))
       .until(and(hasLabel('contact').has('type','CONTACT_USER'),not(cyclicPath())))
     .limit(600)
     .tail(local)
     .groupCount().by('name')
     .order(local).by(values,desc)
Dossier queries

Participants per project

g.V().hasLabel('dossier').group().by(values('name'))
     .by(inE('participates').count()).unfold()

Projects per phase

g.V().hasLabel('dossier').group().by(values('phase')).by(count()).unfold()

Dossiers per category

g.V().hasLabel('dossier').group().by(outE('parent')
     .inV().values('name')).by(count()).unfold()

Dossiers' category

g.V().hasLabel('dossier').out('parent').path().by('name')

Dossiers' category path

g.V().hasLabel('dossier').repeat(out('parent').simplePath())
     .until(out('parent').count().is(0))
     .path().by('name')
Gephi

Gephi is an amazing visualization and exploration program for all kinds of graph and networks. It's also open-source and free. Gephi has multiple plugins, to help with graph data analysis and layouts.

You can use Gephi as a standalone application, or as a Gremlin Console plugin.

Gephi plugin

Before starting, you need to have Gephi installed. For Linux systems, preferably use the distribution installer.

Once installed, follow the Gephi plugin instructions.

Running the console

If you are using Docker, you will need to allow using the host network, where Gephi was installed.

sudo docker run -it --rm -v ~/Public/tinker:/tinker --network host tinkerpop/gremlin-console

Activating Gephi

:plugin use tinkerpop.gephi
:remote connect tinkerpop.gephi

Sending graph to Gephi

:> graph
Gremlin scripts

Elephant includes an executor of Gremlin scripts. It's not intended to substitute the Gremlin Console, and does not use Groovy, but only the Gremlin language.

Gremlin macros

Elephant includes a set of dynamic macros, in order to render Gremlin results in a fancy manner.

Gremlin
Macro processor

@{gcchart ( height , name , root , roots ) }
Atributs Descripció Per defecte Opcions
height CSS style height.
name Attribute name.
root
roots

@{gchart ( data , height , order , roots , title , type ) }
Atributs Descripció Per defecte Opcions
data
height CSS style height.
order asc, desc
roots
title
type Only items with type. line, pie

@{gcindicator ( name , root , roots ) }
Atributs Descripció Per defecte Opcions
name Attribute name.
root
roots

@{gckpi ( name , root , roots ) }
Atributs Descripció Per defecte Opcions
name Attribute name.
root
roots

@{gconcept ( class , name , root ) }
Atributs Descripció Per defecte Opcions
class Writes true or false expressions depending on whether class could be instantiated.
name Attribute name.
root

@{gctable ( name , root , roots ) }
Atributs Descripció Per defecte Opcions
name Attribute name.
root
roots

@{gcview ( concept , limit , root , roots ) }
Atributs Descripció Per defecte Opcions
concept
limit
root
roots

@{gindicator ( roots , value ) }
Atributs Descripció Per defecte Opcions
roots
value Value to search for.

@{gkpi ( format , now , period , roots , then ) }
Atributs Descripció Per defecte Opcions
format Format used to show the value. percentage, difference
now
period month, year, lastYear, lastQuarter, lastSemester, semester, lastMonth, quarter
roots
then

@{gtable ( order , roots , rows ) }
Atributs Descripció Per defecte Opcions
order asc, desc
roots
rows

@{gview ( entities , limit , matching , ranking , roots , template , tmpl-root ) }
Atributs Descripció Per defecte Opcions
entities
limit
matching
ranking
roots
template Template used to show the items.
tmpl-root Templates root.

Macro examples

These are ElephantGraph, real-data, dynamic macros examples.

Phase Projects
Resolution 1
Incubator 3
Idea 9
Execution 15

How?

Preventing macros from execute
The following EWiki code adds an empty space after @ and before { to prevent the macro from executing. Remove the spaces if you're planning to use it in your site.
@w{cards(class=three)}
@ {gview(entities="projects-random",ranking="project-alltime",matching="project-relations",tmpl-root="dossier",template="project-cards",limit=3)}
@w{/cards}

@w{grid(class=two column)}

@w{column}
@w{table(class=definition)}
@w{theader(values="Phase|Projects")}
@ {gtable(rows=projects-phase)}
@w{/table}
@w{/column}

@w{column}
@ {gchart(title="Projects phase",type=pie,data=projects-phase,height=300px)} 
@w{/column}

@w{column}
@ {gchart(title="Dossier status",type=pie,data=dossier-status,height=300px)} 
@w{/column}

@w{column}
@ {gchart(title="Issues priority",type=pie,data=issues-status,height=300px)} 
@w{/column}

@w{/grid}
Gremlin concepts
Full featured concepts
Gremlin concepts is at production stage, and available in macros.

What is a Gremlin Concept?

Concepts were developed to allow the creation of views, indicators, KPIs and tables, based on scripts and supporting ranking and matching sort orders. Macros can expose entities by directly calling the scripts, concepts get rid of all the boilerplate.

Concept's composition

View Description
Usage Simple entity lists, without navigation. Accepts the limit parameter in macros. Example usage include landing pages with short listings.
Root Refers to the entity root. This value tells the view which entities are retrieved.
Name Concept's name, as it will be invoked within macros or iterators.
Description Supporting text for final users.
Entities Script retrieving the entities for this view or iterator.
Ranking Script with ranking sort order. Returns entity's ID and the ranking value.
Matching Script with matching sort order. Requires the use of {{contactId}} expansion macro, in order to match the entities with the given user.
Template Template to be used when showing the entity listing. This template receives the actual entity, with full data.
This value can be overriden by iterators.
Full template Template to be used when showing the full entity. This template receives the actual entity, with full data.
This value can be overriden by iterators.
Indicator Description
Usage Statistics, dashboards. Since returns a single value, can be independently formatted and named.
Root Refers to the entity root. This value tells the view which entities are retrieved.
Name Concept's name, as it will be invoked within macros or iterators.
Description Supporting text for final users.
Value Script with the value. Returns a single value.
KPI Description
Usage Statistics, dashboards. Since returns a single value, can be independently formatted and named.
Root Refers to the entity root. This value tells the view which entities are retrieved.
Name Concept's name, as it will be invoked within macros or iterators.
Description Supporting text for final users.
Now Script with the current value. Indicator scripts can be used. Returns a single value.
Then The same script than Now, but must support the {{period}} expansion macro, in order to return a past value.
Format Indicates whether to return the difference between Now and Then in a value or a percentage.
Periode Indicates which period to use to create the Then value.
Table Description
Usage Statistics, dashboards. Simple entity = value lists, without navigation. Accepts the limit parameter in macros.
Root Refers to the entity root. This value tells the view which entities are retrieved.
Name Concept's name, as it will be invoked within macros or iterators.
Description Supporting text for final users.
Rows Script with the list of entity IDs and a related value. Simple view for entity/value list, mostly used for entity = count of related entities.
Order Indicates whether use ASC or DESC sort order.